
Learn about isobars, lines on weather maps connecting points of equal atmospheric pressure, crucial for forecasting and understanding weather patterns.
Understanding Isobars in Meteorology
Isobars are essential tools in meteorology, helping professionals and enthusiasts alike to predict weather patterns and understand atmospheric pressure variations. But what exactly are isobars, and how do they help us in forecasting weather? This article will delve into the science behind isobars and their significance in meteorology.
What are Isobars?
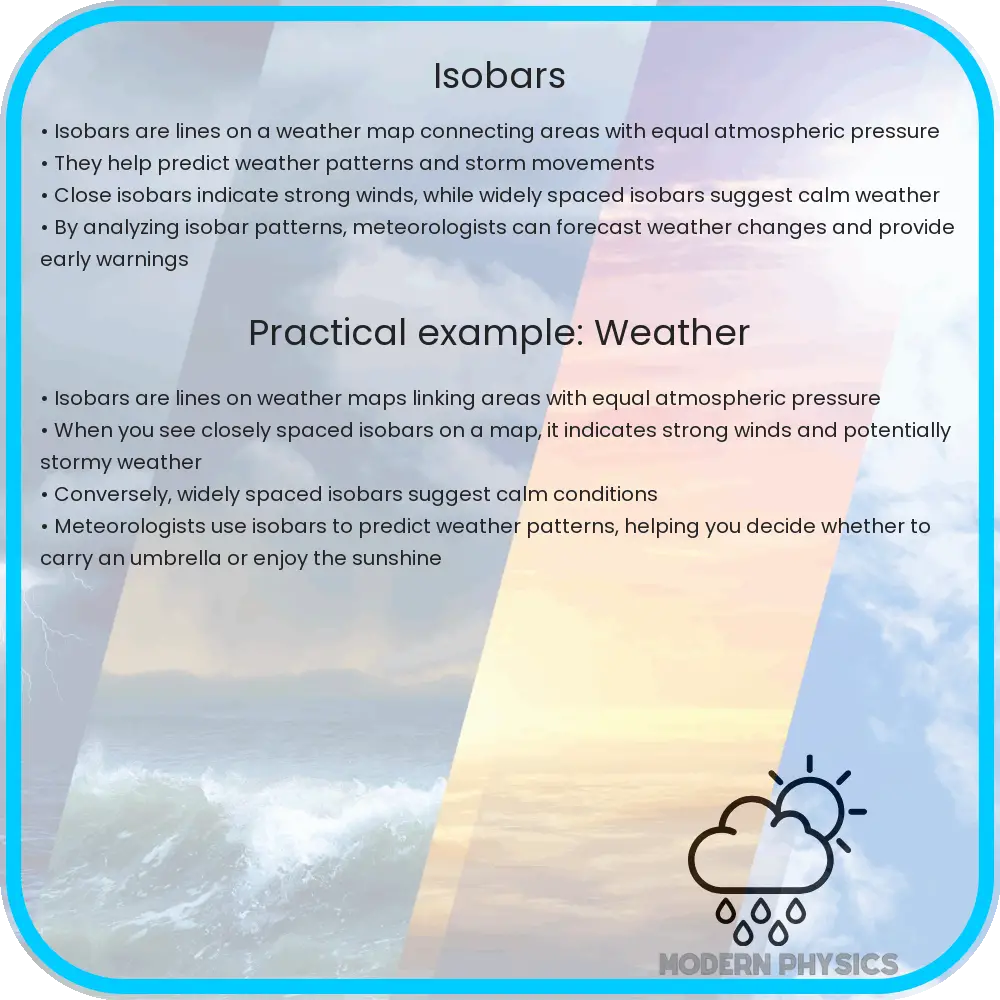
Isobars are lines on a weather map that connect points of equal atmospheric pressure. Measured in units such as millibars (mb) or hectopascals (hPa), these lines provide a clear visual representation of pressure variations across different geographical areas. By studying the arrangement of isobars, meteorologists can infer wind speeds, the movement of weather fronts, and the potential for storms or calm weather.
How Isobars Influence Weather Patterns
The spacing between isobars is indicative of the strength of wind in an area. Closely spaced isobars represent steep pressure gradients and are typically associated with strong winds and dynamic weather systems. Conversely, wide spacing suggests gentle gradients and usually correlates with mild winds and stable weather conditions.
- High Pressure Systems: When isobars form closed circles with no other isobars entering the circle, it indicates a high pressure system. High pressure systems are generally associated with clearer skies and calmer weather.
- Low Pressure Systems: On the other hand, if the closed circles of isobars show decreasing pressure values toward the center, it’s indicative of a low pressure system. Such systems often bring about cloudiness, precipitation, and stormy conditions.
The Role of Pressure in Determining Weather Patterns
Atmospheric pressure is a primary driver in the formation of weather patterns. Air moves from areas of high pressure to low pressure. As it moves, the characteristics of the air can change significantly; for instance, warming or cooling, which then affects cloud formation and precipitation levels.
Understanding how pressure affects weather is crucial for predicting changes in the environment. Fluctuations in atmospheric pressure can change wind patterns and influence global climate dynamics, including phenomena like monsoons and trade winds.
Reading Isobar Maps
Isobar maps provide a snapshot of the pressure layout over a large area, often overlaid with other weather symbols that indicate different phenomena such as precipitation, cloud cover, and temperatures. When reading these maps:
- Identify the pattern of the isobars. Note whether they are closely packed or widely spaced.
- Look for any closed loops of isobars, as these usually indicate the existence of high or low pressure systems.
- Observe the general direction in which isobars are oriented to predict wind direction; winds generally flow perpendicular to isobars due to the Coriolis effect, flowing from high to low pressure in the Northern Hemisphere, and the reverse in the Southern Hemisphere.
- Combine the isobar analysis with other meteorological data presented on the map for a comprehensive weather forecast.
By analyzing these maps, meteorologists can make educated predictions about the upcoming weather, helping governments, businesses, and individuals prepare for future climatic conditions.
Technological Tools for Isobar Analysis
In modern meteorology, the analysis of isobars is greatly aided by technological tools. Satellites, radar systems, and computer models provide extensive data that meteorologists use to create more accurate and detailed isobar maps. These tools allow for real-time monitoring of pressure changes, aiding in more precise weather forecasting.
- Satellites: Offer a broad view of atmospheric conditions over extensive areas, making it easier to track changes in pressure systems globally.
- Radar: Helps in detecting precipitation and its intensity, which can be linked with low pressure systems on isobar maps.
- Computer Models: Use vast amounts of data to simulate weather patterns, including the movement of isobars, to predict future conditions.
Educational Importance of Isobars
Isobars are not only useful for professional meteorologists but are also essential in educational contexts. Teaching about isobars in schools helps students understand fundamental aspects of geography and earth sciences. It instills a basic understanding of how atmospheric conditions are interconnected with environmental changes and weather phenomena.
By learning to read isobar maps, students and enthusiasts can appreciate the complexity of weather systems and better understand the dynamics that govern our planet’s climate.
Conclusion
Isobars are integral to the field of meteorology, providing crucial insights into atmospheric pressure variations and their impact on weather patterns. The ability to analyze and interpret these lines on weather maps allows for accurate predictions, which are vital for planning and preparedness in various sectors. Advances in technology continue to enhance the precision of isobar mapping, making weather forecasting more reliable than ever. Whether for professional meteorologists, students, or weather enthusiasts, understanding isobars is key to comprehending the broader climatic systems that affect our everyday weather. As we continue to witness changes in our global climate, the importance of mastering this aspect of meteorology only grows, highlighting the need for continued learning and adaptation in the field.